Your choices so far:
1 Wind
| What is your resource? | What do you want to deliver? | What is the service the customer wants? |
| Biomass (digestible sludge) | District cooling | Comfortable indoor climate |
| Biomass (fermentable sludge) | District heating | Electricity |
| Biomass (solid) | Electricity | Process cooling (< 0 °C) |
| Geothermal | Fuel: Gaseous | Process heat/steam (50 - 150 °C) |
| Sunshine | Fuel: Liquid | Process heat (150 - 1000 °C) |
| Water | Fuel: Solid | Process heat (> 1000 °C) |
| 1 Wind | Local cooling (ind. house) | Transport |
| Residual oils/fats etc | Local heating (ind. house) |
Just like in water, the energy found in moving air is basically exergy and since this is also the form of energy in electricity, wind shall be used to produce electricity and basically nothing else. The number of wind power installations is rapidly increasing and in combination with the increasing sizes of the plants installed, wind power electricity is one of the most rapidly growing sectors in the European energy system and is expected to be comparable to the hydropower production by the year 2020. Todays' installations will have an anticipated life of 20 years or more and the specific cost is successively decreasing.
At the same time as the size has increased has the versatility of the gearbox and other mechanical components improved and todays windmills exhibit significantly less maintenance costs than older designs. Also the blade design has improved during the last decades yielding turbines with lower start-wind speeds than previously.
Wind power stations come in all sizes from only few kW up to 5 MW. The smallest units are suitable for installation in the single household. However, there are a number of restrictions that may apply and before a single-home installation is done, you are advised to take good care to see which restrictions and considerations apply in your own area.
As a contrast to hydropower stations, all windpower installations suffer from the so-called "Betz limit" according to which the highest possible, theoretical efficiency is limited to about 60% (16/27 to be accurate). This limit applies also to the specific case of submerged hydropower stations but not to the other types of hydropower installations.
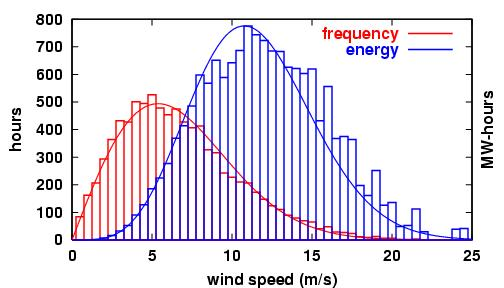
The energy potential in the blowing wind is usually characterised in "W/m2 swept area", i.e. it is the power latent in the wind measured per square meter at a right angle to the direction of the wind. The energy potential is proportional to the wind speed raised to the power of three which means that the main part of the wind energy – on an annual basis – comes with the high wind velocities, even though these may be relatively scarce. The qualitative sample schematic illustrates the situation.

The red rectangles in the schematic illustrate the annual duration of different wind speeds while the blue rectangles illustrate the annual energy, as MWh/m2 swept area. It is clearly seen that though wind speeds exceeding 15 m/s are scarce, the total energy represented by these wind speeds is a significant portion of the total latent energy. The solid red curve represents the Weibull distribution which is the theoretical model usually applied to describe the annual duration of different wind speeds.
The schematic serves to illustrate and to enforce the fact that a thorough wind mapping must always proceed any plans for windpower installations. Wind maps, maps showing the latent energy in the wind at different heights, are available for just about every location and detailed statistics will be available from the national meteorological offices. The schematic also illustrates the importance of choosing the correct design and operating range of the wind power station and that this choice must be based on a detailed knowledge about the local wind conditions.
The main advantage of windpower is obvious: Once installed it will produce electricity without any emissions.
However, there are also disadvantages: While most people have a positive attitude to wind power installations, it is common that new installations will meet a strong local opposition. This is known as the "NIMBY"-syndrome, "Not In My Back Yard". The reasons are often the fear of noise and the fear of flickering shadows but also landscaping aspects may be hindrances for new installations.
There is also one major technical disadvantage, being that the wind is un-predictable. A wind power station will produce electricity when the wind blows, its output power will vary continuously as the wind speed changes and when the wind stops blowing – or drops below a limiting velocity – production will cease. This poses a problem with the balancing of the electricity grid and it is possible that the local grid owner may be reluctant to accept too much wind power production in a local section of the electricity grid.
Wind power stations come basically in two different models:
- Those with a vertical axis, like the egg-shaped Darreius wind turbine
and - Those with a horizontal axis, mounted on a tower and with a one-to-four-bladed propeller
The latter type – horizontal axis turbines – is completely dominant today and the most common type will have three-bladed turbines since these show a good compromise between the total weight of the propeller and the total efficiency. The potential production increase when adding one more blade does usually not defend the weight increase and the subsequent expenditures for the tower and for the foundation.