05-01 Economics of Ligno Cellulose Biomass Fuel
Biomass of lignocellulosic origin is the most abundant source of organic material on Earth. It comes from forests, agricultural and forest cultivation, harvest, forestry and industrial residues, and cellulose and recycled paper (Billa, 1993). Lignocellulosic materials result from plant photosynthesis which converts solar energy to organic material, with the benefit of being both biodegradable and renewable. With this approach, the use of lignocellulosic biomass as fuel represents a sustainable and environmentally-friendly method of solar energy exploitation (Dey and Brinson, 1984)
05-01-00 Elements making up total fuel cost
Introduction
As outlined in chapter 03-00 the variety of materials which can be utilised for use in a ligno cellulose fuel process are considerable. The key characteristics which will affect the cost element of the resource to be used are:
• Raw material purchase.
• Transportation of raw material to the process site.
• Storage of raw material.
• Processing.
• Loading of delivery wagon at processing site
• Transportation to fuel end user.
The cost of each link in the chain will vary across EU regions. Indicative figures of each are represented in Table 05-01-01 2.
However generally, there are numerous factors that affect the price of chips—everything from the competing markets’ relative strength or weakness at a given point in time, to the cost of diesel used to run harvesting and processing equipment and trucks, to extended periods of wet weather.
05-01-00a Macro-economics
In traditional macro-economic theory, supply and demand within a free market system will reach a price and quantity equilibrium point. Any shift in the demand can be measured in what price increase (p1 to p2) is necessary to secure the additional quantity (q1 to q2) of a given goods.
Figure 05-01-01 1
Unfortunately, wood fuel markets do not behave this simply. In economic theory, the price elasticity of supply of a product is measured by the responsiveness of the quantity supplied to a change in price of product. Price elasticity is measured as the percentage change in supply that occurs in response to a percentage change in price. By-products of harvesting and manufacturing other wood products will be comparatively inelastic because the quantity supplied to the market will not respond to an increase in price in the same way a primary product will respond to a similar price increase.
Again, there are many variables to consider. The most important of these is the extent to which the economics of harvesting low-grade wood depends on integrating the harvesting of more valuable products to subsidize extraction of the low-grade wood.
Because the wood-energy industry has relied on the low-value wood by-products from other wood-using industries, it has not controlled wood prices in the market the way the pulp and paper and timber industries have. The pulp and paper industry has had a strong command of its supply and has the greatest impact on the biomass energy sector’s wood supply and price.
Fig 05-01-01 2: 10 year mean of woodchip price in New Hampshire (US)
There are two scenarios that demonstrate the supply/demand influences and wood price impacts related to pulp mills and the biomass power plants. In the first scenario, when pulp and paper regional markets are strong and ramping up production, biomass power plants have to pay more for wood. A strong paper industry tends to use more marginal wood because their demand for wood feedstock is high. When the Euro weakens, it is good for EU manufacturers. Suddenly those competing products from US, Asia, South America and Canada are more expensive. It becomes easier to export and harder to import. The wood or paper product is more competitive than it was yesterday with no change in its production. The domestic paper or wood products industry then ramps up production and uses more wood. Wood that was previously sent to the chipper now is not sent and is therefore less available for biomass. The graph above shows the price data for New Hampshire over the past 10 years. The graph shows distinct peaks and valleys in the chip prices that can be tied directly to major events in the pulp market during that same time. For example, the original closure of the Berlin, New Hampshire pulp mill in 2001 initially sent the chip prices down. When harvesting capacity was lost and the mill then reopened two years later, the prices went back up.
But there is another, somewhat opposite, factor/scenario that influences the supply and demand balance between pulp mills and biomass plants. When pulp mills are strong and their demand goes up, more roundwood is cut —leaving more tops and limbs on the landing to be fed to the chipper. Conversely, if the pulp market is weak and biomass is not paying enough to cover the harvesting costs, less roundwood is cut and less top and limb wood is left for chipping on the landing. Which factor plays out over the other depends on the markets and the harvest specifics from woodlot to woodlot.
Similar trend has occurred in Sweden with a price rise mid 2000s due to increased pressures from paper mills and the fibre board industry.
05-01-01: Sources and Economics of the Raw Material
Source of material: Refer to Chapter 02-01 for more detail on origin.
• Forrest Pulpwood: must be purchased.
• Wood Processing Waste Origin: may have zero charge.
• Recycled Wood Origin (Untreated Waste Wood): may collect income as waste.
Typical life cycle for ligno cellulose such as Sitka Spruce.
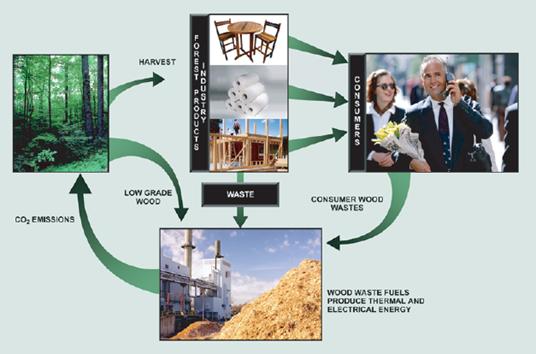
Figure 05-01-01 2: Life Cycle of Ligno Cellulose indicating potential sources of raw material.
By-products from logging operations, wood residues from manufacturing, and clean, burnable solid wastes that would otherwise go to landfills are all sources of low-cost wood-waste fuels. In contrast to fossil fuels, the combustion of wood fuels adds no new CO2 to the atmosphere.
05-01-01a: Raw Material Costs - examples
The varying sources of wood fuel prices are categorised as per previous section. The prices were reviewed across each region and graphed in Figure 05-01-01 3.
Figure 05-01-01 4: Raw (Pulpwood) Material Costs
The review of the various regions shows that the cost of pulpwood is influenced by many factors. One that has to be considered is the maturity of the market in which one is purchasing. Ireland has a very young market for biomass fuel and also strong competition for the pulpwood from board mill market. The Swedish, with a larger more developed market, on the other hand have been forced to adapt to the use of brash and stumps as a source of biomass and this has helped to reduce the cost of fuel.
05-01-01b: Material Processing Cost - examples across EU Regions
The processing cost associated with fuel production has many factors. Table 05-01-01 1 below shows the cost distributions from each region and also the elements that form part of the fuel supply chain.
| Elements to make up the total wood fuel cost | Atlantic Ireland Chips |
Boreal Sweeden Chips |
Continent Austria Pellets |
Mediteran Portugal Pellets |
| Price for Pulpwood (€/tonne) | 35 | . | 33 | 15 |
| Brash (€/tonne) | . | 30 | . | . |
| Transport to process site (€/tonne) | 10 | 10 | . | 35* |
| Processing at site (€/tonne) | 10 | 10 | 51.1 | 5 |
| Loading of Delivery Wagon (€/tonne) | 2 | 2 | . | 12 |
| Storage (€/tonne) | . | . | 1.8 | . |
| Transport to boiler (€/tonne) | 35 | 35 | . | 19** |
| Processing Total (€/tonne) | 92 | 77 | 85.6 | 85 |
| % losses in processing | 3 | 3 | 2.57 | 2.54 |
| Processing Margin @ 16% | 15 | 12 | 14 | 14 |
| Total Delivery Cost (€/tonne) | 109 | 89 | 102 | 101 |
Table 05-01-01 2
: Examples of cost distributions – indicative numbers
* Assuming 40 km at 0.24-0.61 €/tonne km
** Assuming 40 km at 0.06-0.09 €/tonne km
As one can see the Swedish wood chip industry is most developed over the past 30 years has resulted in the 10-15% lower cost of chip due to the maturity of the market.
On this basis the life cycle cost and learning curve effect that each doubling of the market share should allow the cost reduction by 10-15%. It is
therefore a consideration in designing projects that the cost of fuel over the life cycle can be affected by
• Macro Economics
• Availability of raw material and development of new resource streams.
• Maturity of the market.
&
• External costs to the supply chain. (Transport, bulk density, drying costs etc.)
In summary. In your region which of the above is likely to have the greatest impact on fuel price.
05-01-02: Elements Making up Total Equipment Cost
05-01-02a: Capital Costs (CAP EX)
Capital costs are defined as cost of capital: the opportunity cost of the funds employed as the result of an investment decision.
Initial and Capital Expenditure Costs could include the following:
• Feasibility studies
• Development costs (e.g. Power Purchase Agreement (PPA) & planning permissions)
• Engineering costs (e.g. design)
• Development contributions
• Renewable energy equipment
• Balance of plant (e.g. civil works, grid)
• Miscellaneous (including contingencies).
For most renewable energy systems the capital costs are significant and are the most important component in any calculation.
05-01-02b: Annual Costs (OPEX)
[Coford Strategic Study Maximising the potential of Wood Use for Energy Generation in Ireland]
Annual Costs can be divided into operation & maintenance (O&M) costs, fuel and electricity costs and debt payments. In many cases these costs have
to be spread over the life time of the project e.g. 25 years and the costs need to be covered every year from the annual income.
• O & M costs include land lease, insurance, operation, maintenance (parts & labour), community contribution and administrative costs. O&M
costs are spread over the length of the project lifetime.
• Fuel and electricity costs for some renewable energy projects can be significant. For bio energy projects, the cost of fuel can be a major component
of the annual costs (e.g. purchase of wood chips) and a bio energy plant may have a significant electricity demand (e.g. for operation of augers, pumps).
• Debt Payments will reflect your decision as to what percentage of initial costs will be funded by equity and what percentage by debt. Your debt
payments will depend on the debt interest rate and the term of the debt.
The breakdown of annual costs of biomass-based (CHP) power plants is typically allocated as follows:
• Fuel costs approximately 45%
• Operation and maintenance 25%
• Other/investment costs 35%
For smaller units the share of investment is usually higher. Annual maintenance cost (including periodic overhaul requirements) is typically 1‑1.5% per cent of the initial investment cost. Refer to case study e indicating some of the cap ex and op ex for heat entrepreneur selling heat on a network or grid.
Below reference Table 05_01_02 1 are some real life practical examples that have been analysed in Sweden to illustrate the built cost of plant and grid networks in the medium to large scale.
| Example | Plant Size (MWth) |
Heat Delivered (GWh/year) |
Capital Expenditure (m€) |
Cost of Plant (€/kWth) |
` Investment Cost in Network (€/m) |
| Sweden A | 1.5 | 14 | 1.3 | 421 | 281 |
| Sweden B | 1.5 | 2.1 | 0.74 | 490 | 167 |
| Sweden C | 5 | 17 | 3 | 610 | 267 |
Table 05-01-02 1: Typical Swedish investment cost of biomass power plant, €/kWth
Below reference Table 05_01_02 2 is a guide when planning such a network to allow the designer to estimate the capital expenditure involved in a project of this nature.
It must be noted that Table 05-01-02 1 is small subset of practical examples and too big a conclusion cannot be drawn from the fact that there are some differences in costs represented in each. One has to assume that the influences of local or regional factors in the economics of a project must be factored in. For example, is the geology of the ground in which the network is to be installed likely to be difficult leading to higher project cost.
As a rule of thumb it is fair to estimate costs based on Table 05-01-02 2 for initial non detailed project cost estimates. Naturally all prices are subject to verification at tender stage. Distinct differences can be experienced from country to country.
| Plant Size MWth | Specific Cost (€/kW) |
| 0.1 - 0.5 | 150 - 200 |
| 0.5 - 1 | 100 - 200 |
| 1 - 5 | 150 - 250 |
| 5 - 30 | 275 - 400 |
Table 05-01-02 2: Typical Plant Costs Austria
| Nominal size of the Distribution grid |
Specific Investment costs (€/m) |
| DN 0 - 65 | 300 - 400 |
| DN 80 - 125 | 500 - 600 |
| DN 150 - 200 | 750 - 900 |
| DN 250 - 300 | 900 - 1 100 |
Table 05-01-02 3: District Heating Network Costs Austria
There are more references to projects in various countries below in Table 05-01-02 4 that detail elements of the project cost make up that relate to development of nearby or small scale heat plants.
| UK London City 1 060 MJ |
Ireland Case study 3b 1 090 MJ |
Slovenia Example 2 300 MJ |
|
| Feasibility Study | 3 152 | 1 000 | 7 000 |
| Development | 3 152 | 0 | 28 000 |
| Engineering | 5 516 | 0 | 105 000 |
| Heating System | 117 314 | 159 950 | 995 600 |
| Ballance of system & misc | 17 421 | 5 400 | 215 130 |
| Total | 146 555 | 166 350 | 1 350 730 |
Table 05-01-02 4: Actual plant costs of plant installed
Using the provided cost tables and explanations a designer may provide some useful information to a heat user that is considering implementing a small, medium or large scale biomass heat plant or heat network on potential capital and operational expenditure.
05-01-03: CASE STUDIES
05-01-03a: Finnish Case Study on Cost of Pellet Production [Thek et al. 2001]
The following is based on the Finnish experience of wood pellets. The consumer price of pellets is based on production costs, transport costs, taxation and business profit. The production costs can be sub-divided to capital costs, raw material costs and other operating costs. It is difficult to itemise costs exactly, as the pellet producers regard the costs as commercially sensitive.
| €/GJ | |
| Capital Costs Including | 0.34 |
| Buildings | |
| Machinery | |
| Equipment | |
| Transportation Equipment | |
| Raw Materials Costs Including | |
| Cutter Shavings (MC 10-15%) | 1.9 |
| Sawdust (MC 50-55%) | 1.2 - 2.2 |
| Other Operating Costs Including | 3.9 |
| Wages | |
| Salaries | |
| Operating Staff Overhead Costs | |
| Service | |
| Repairs | |
| Insurance | |
| Transport Costs | 0.5 €/Km |
Table 05-01-03 1: Cost of pellet production in Finland
Total Costs
According to Finnish evaluations the total production costs of pellets range from 52.2 to 81.3 €/t without drying and from 73.5 to 94.6 €/t if the process needs drying. The distribution of the costs is presented in Figure 05-01-03 5. The costs of drying are dependant on the technology and ranges from 25 €/ tpellets to 29 €/ tpellets. The production costs are also depending on the annual operation time. If a plant is running in 3 shifts 7 days in a week, costs are 84 €/ tpellets, compared with 3 shifts and 5 days a week, 90 €/ t pellets, 2 shifts and 5 days a week 101 €/ tpellets and for 1 shift and 5 days a week 133 €/ tpellets.
Figure 05-01-03 5: Pellet costs without drying (left) and with drying (right)
05-01-03b: Limerick Institute Tipperary (LIT) Case Study
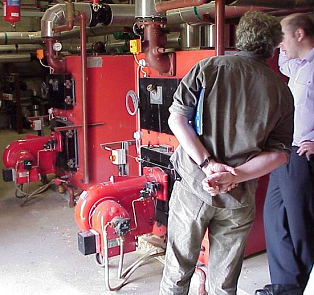
LIT Tipperary examined the feasibility of using wood fuel to provide space heating and hot water for its main building on the campus in Thurles town. At present the main building is heated by two oil-fired boilers, each rated at 700 kWth maximum output which uses a total of 40 000 litres of kerosene per year. The boilers operate alternately – the heat demand of the building does not require both to operate simultaneously.

|
|
|
Figure 05-01-03 2: LIT Tipperary, oil tank and oil-fired boiler Photographs by Tipperary Institute
Figure 05-01-03 3: Irish Case Study CAP EX vs. OP EX
LIT Tipperary has now procured the boiler and it has been installed on a heat supply agreement for 5 years. Above in Figure 05-01 6 show the range of tenders received for capital expenditure and operation expenditure.
When the life cycle cost over 5 years the preferred bidder was option E.
05-01-03c: Standard Short Wood Harvesting of Conifer First Thinning for 3 m Pulpwood and Industrial Round Wood Case Study [Pieter D. Kofman and Tom Kent ]
Introduction
Harvesting 3 m pulpwood in combination with industrial assortments, such as small sawlogs or stakes, is the standard method of first thinning in conifer plantations. Branches and tops are placed on the rack to make a brash mat, which protects the soil and prevents machines from bogging. Pulpwood has a length of 3 m (± a few centimetres), with a minimum top diameter of 7 cm. Small sawlog, or boxwood, is cut to 2.5 m lengths, with a minimum top diameter of 14 cm. Stake wood is not produced on every site, as suitable logs must be straight with a low taper, in addition to meeting the required size specifications. Averages for each of the three years of the programme are presented. Table 1 shows the average results of the operations in 2006, 2007 and 2008 for harvesting, forwarding and chipping m3 pulpwood from large stacks at roadside.
Results
The harvesting costs were more or less the same in 2006 and 2007 (the wood chipped in 2008 was harvested in 2007). The forwarding in 2007 was more expensive because of the lower ground bearing capacity and/or steeper ground at the sites investigated. The total average production cost of wood chip from m3 pulpwood ranged from € 46.0 to € 48.5 per m3. When the moisture content is factored in, the production cost per unit of wood energy ranged from
€ 6.49 to € 7.59 per GJ. See Table 05_01_03 1 from studies completed in Ireland.
| Year | 2006 | 2007 | 2008 |
| Number of Sites | 3 | 4 | 4 |
| Thinning Type | Line and Selection | Line and Selection | Line and Selection |
| Thinning Method | Harvester and Forwarder | Harvester and Forwarder | Harvester and Forwarder |
| Harvesting Productivity (m3 sb/pmh) | 3.9 | 3.9 | 3.9 |
| Forwarding Productivity (m3 sb/pmh) | 10.3 | 8.5 | 8.5 |
| Chipping Machine | Jenz 700 | Musmax T8 | Starchi/Jenz 400/700 |
| Roadside Chipping Productivity (m3 sb/pmh) | 36 | 12.9 | 32.9 |
| Roadside Chipper cost (m3 sb/pmh) | 7.9 | 7.9 | 7.9 |
| Total cost (€/m3 sb) | 46.1 | 48.5 | 48.5 |
| Average energy content at seasoned MC (GJ/m3) | 7.1 | 6.4 | 6.9 |
| Average energy cost at transport vehicle (GJ/m3) UNIT?? | 6.49 | 7.59 | 7.03 |
Table 05_01_03 2: Overview of productivity and costs of the standard pulpwood harvesting with roadside chipping of conifers in Ireland.
Production costs in 2007 and 2008 were similar, although the energy production cost was lower, as the wood was drier in 2008 and therefore had higher energy content. The differences between the two years were small, even though there was a large difference in the productivity of the different machines that were used. However, the low productivity of some of the machines was compensated by a lower hourly cost.
The total harvesting cost at the roadside delivered in transport vehicles was € 6.50 to € 7.60 per GJ. If the forest owner was paid € 5 per m3 solid biomass (stumpage), then that would add € 0.70 per GJ to the cost. The cost of road transport needs to be added to obtain the delivered-in cost at the combustion facility. An average transport cost of € 1.50 would give a delivered-in cost of € 9.57 to € 10.78 per GJ, which includes a 10% overhead for the wood fuel trader.
Typical component costs to arrive at a delivered-in price are summarised as:
| Raw Material | Cost (€/GJ) Ireland |
| 0.7 |
|
| Chipping | 6.5 - 7.6 |
| Road transport 50Km | 1.5 |
| Traders Allowance 10% | 0.87 |
| Delivered in cost | 9.57 - 10.78 |
Table 05-01-03 3: Delivered in price Ireland
05-01-03d: Conifer Wood Fuel Production Costs in Ireland[Harvesting Woof for Energy Cost Effective Wood Fuel Supply Chains in Ireland ]
| Conifer Wood Fuel Production Cost in Ireland | €/GJ |
| Short wood harvesting, forward extraction and roadside chipping | 5.65 - 8.64 |
| Energy wood harvesting, forward extraction and roadside chipping | 5.05 - 7.52 |
| Whole tree harvesting and terrain chipping | 2.22 - 4.36 |
| Chemically treated sites and Silvatec chipper used to fell trees | 4.36 - 5.86 |
| Whole tree harvesting, winch extraction and roadside chipping | 6.47 - 10.20 |
| Firewood production using chainsaw harvesting, ATV extraction and a firewood processor | 17.35 - 33.72 |
Table 05-01-03 4: Conifer Wood Fuel Production Costs in Ireland
05-01-03e: Wood Energy Contracting Project in Oberaich Austria 2005 Case Study [Telling the story in Austria – Sustainable wood energy supply]
Property supplied: primary school, 4 single occupancy homes
Plant data: Connected load: 170 kW
Annual heat requirement: 210 MWh
Fuel storage area: 60 m3 AREA???
Annual wood chip consumption: 330 loose cubic meters
System operator: 7 farming operations
Cost structure (Price excluding VAT)
| Cost | € |
| Investment Costs | 56 000 |
| technicial Equipment | 33 000 |
| Electricial heating insulation | 5 000 |
| Structural measures | 3 000 |
| Heat Supply pipeline 140m | 15 000 |
Table 05-01-03 5: Operational Cost for Heat Supplier
Income structure (Price excluding VAT)
| Income side | € |
| Connection charge per kW installed | 150 |
| Service charge per kW/year | 20.70 |
| Energy charge per MWH | 59 |
| Meter charge per month | 0 |
| Primary School | 9.75 |
| Residential Buildings | 7.50 |
Table 05-01-03 6: Cost Structure – Income from Clients for heat supplier